- Diversified UA
- Posts
- Attribution Literacy: Making Confident Decisions with Imperfect Data
Attribution Literacy: Making Confident Decisions with Imperfect Data
How to make confident scaling decisions when every platform tells you a different story.
Daniel Avshalom
November 01, 2025

🧠 Insight Block — The Confidence Gap: Why Most UA Teams Still Struggle Post-SKAN
You just spent $50K on iOS campaigns.
Meta says 3.2x ROAS. SKAN says 1.8x. App Store Connect says 2.1x.
Which one do you believe? And more importantly — do you scale or pause?
Four years post-ATT, this is still the question that paralyzes UA teams.
For teams who grew up on user-level attribution, this isn’t just a technical challenge — it’s a psychological one. They’ve lost the comfort of certainty.
In the deterministic era, UA felt simple: same input, same output, perfect tracking, total control. But post-SKAN, the ecosystem runs on probability, not precision.
SKAdNetwork captures about 68% of non-organic installs, and everything else must be modeled or inferred.
That’s why leading UA teams now operate with Triangulated Confidence — making bold, data-informed decisions from imperfect signals.

The Triangulated Confidence Framework
When these three signals align directionally, you have enough to act:
1. Platform Modeled Data Meta’s AEM, TikTok’s ADC, Google’s Modeled Conversions → Shows: Relative performance trends
2. SKAN Postbacks Delayed, anonymized, partial — but privacy-safe → Shows: Directional conversion patterns
3. Blended ROAS Total revenue ÷ total ad spend (all channels) → Shows: True business impact
The magic happens when these three don’t match exactly — but all trend the same direction.

“Stop chasing truth. Start trusting trend.”

The modern UA mindset: The future belongs to operators who think probabilistically, not deterministically — those who can act decisively within uncertainty.
🎯 Permissionless Play — Calm (Real-World Attribution in Action)
Let’s take Calm — a meditation app with $70/year subscriptions and 30-day free trials.
This combination (high ARPU + delayed conversions) is exactly where attribution gets messy. Platform data looks inflated (counting trial starts), SKAN undercounts (postback delays), but App Store Connect shows truth (actual paid conversions).
Here’s a real-world scenario:
Metric | Day 7 | Day 35 |
|---|---|---|
Meta-reported ROAS | 2.4x | 2.6x |
SKAN blended ROAS | 1.8x | 2.1x |
App Store Connect actual | 1.9x | 2.0x |
Old-school interpretation:
“The data doesn’t match. Pause the campaign.”
Modern interpretation (Triangulated Confidence):
“All trends are up. Variance <15%. Let’s scale.”
The Attribution Sanity-Check Bot (more on this below) would flag this as 92% confidence and greenlight budget expansion.
The insight isn’t in precision — it’s in alignment.

🧰 Vibe Tool — The Attribution Sanity-Check Bot (Build in Progress)
To operationalize this mindset, we’re building an Attribution Sanity-Check Bot — think of it as your internal data therapist: calm, rational, and impossible to gaslight with bad numbers.
Instead of staring at three conflicting dashboards and guessing, you get a single Confidence Index (0–100) that tells you:
✅ 85–100: Scale with conviction
⚖️ 65–84: Hold and monitor
🧩 <65: Investigate discrepancies
What It Looks Like in Practice
Here’s the Slack or Notion summary you’d receive:
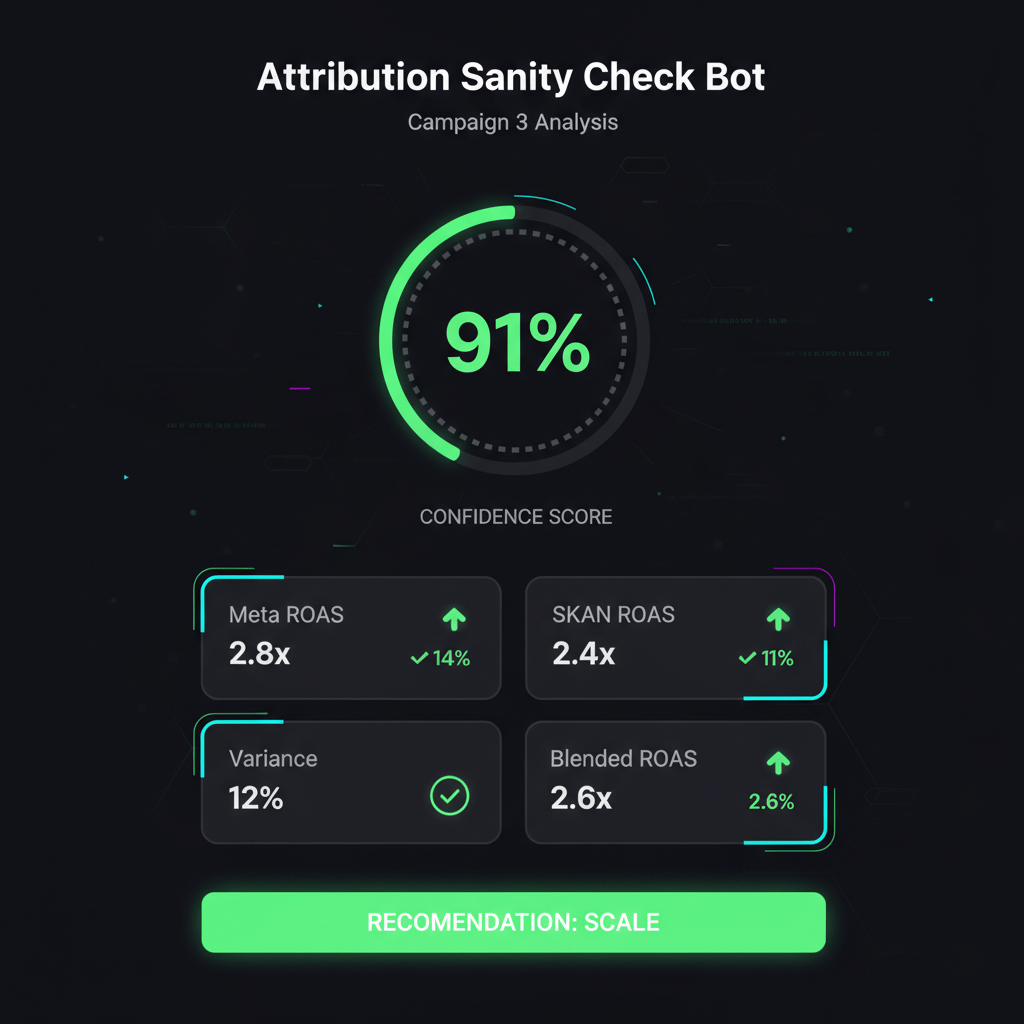
🤖 Attribution Sanity Check — Campaign 3
Confidence Score: 91% ✅
Meta ROAS: 2.8x (+14% vs last week)
SKAN ROAS: 2.4x (+11% vs last week)
Variance: 12% (within acceptable range)
Blended ROAS: 2.6x (trending up)
Recommendation: SCALE All signals align directionally. Increase budget 25%.
How It Works
Goal: Build confidence scores from imperfect data.
Data Inputs:
Meta Ads / TikTok / Google APIs (spend, modeled ROAS)
MMP (AppsFlyer / Singular) postbacks
SKAN conversion values
App Store Connect / RevenueCat actuals
Core Logic:
Flags when platform vs. blended ROAS variance >30%
Checks for SKAN vs. MMP install variance >20%
Detects high null-postback rates (>40%)
Assigns a Confidence Index (0–100) based on signal alignment
Stack:
n8n workflow for data ingestion
OpenAI function for confidence scoring logic
Google Sheets or Postgres for storage
Looker Studio or Retool dashboard for visualization
Ultimately, it’s your internal data therapist: calm, rational, and impossible to gaslight with bad numbers.
💡 Want to see the full n8n workflow blueprint? Subscribers get the technical spec + node configuration as a bonus deep-dive.
🛰️ Field Notes — The Industry Data Tells the Story
We synthesized 40+ 2025 attribution reports through Perplexity to validate what we’re seeing in the field. The numbers confirm the psychological shift:

SKAN systematically underreports by 15% — teams who wait for SKAN and platform data to match will wait forever
Learning phases now take 2–4 weeks — old “72-hour decision cycles” are dead
30–40% null postbacks — privacy thresholds mean you’ll never see complete data
Blended ROAS is the new North Star — the only metric that can’t be modeled away
The takeaway: Teams still waiting for “clean data” are stuck in 2019. The winners moved on.
The teams that win now run bounded uncertainty frameworks — they decide when they have enough signal to move, not when every number agrees.
They’ve swapped “wait for perfect data” for “act with sufficient confidence.”

Early in my UA career, I obsessed over data purity. If numbers didn’t match, I froze decisions.
I remember killing a campaign because Meta showed 2.8x ROAS but SKAN showed 1.9x — a 32% variance that felt “too risky.”
Two months later, the competitor who kept running the same creative at scale was dominating App Store rankings.
That’s when I realized: perfect data was making me perfectly slow.

Post-SKAN, I had to unlearn that. Now I care less about truth — and more about trust.
Trust comes from seeing motion in the noise — when multiple imperfect systems point in the same direction.
That’s explainability over perfection. It’s confidence built through clarity of reasoning, not completeness of data.
The best UA operators don’t need perfect data — they need a repeatable process for interpreting it.
That’s what this issue — and the sanity-check bot — are really about.
🤖 Want the Attribution Sanity-Check Bot when we ship it?
Join 500+ UA operators getting early access to tools, frameworks, and weekly insights.
📅 Next week: Retention–Acquisition Integration — How to run UA like a portfolio manager